Special to Stadium Tech Report by Chuck Lukaszewski, Vice President and Wireless Chief Technology Officer, Hewlett Packard Enterprise
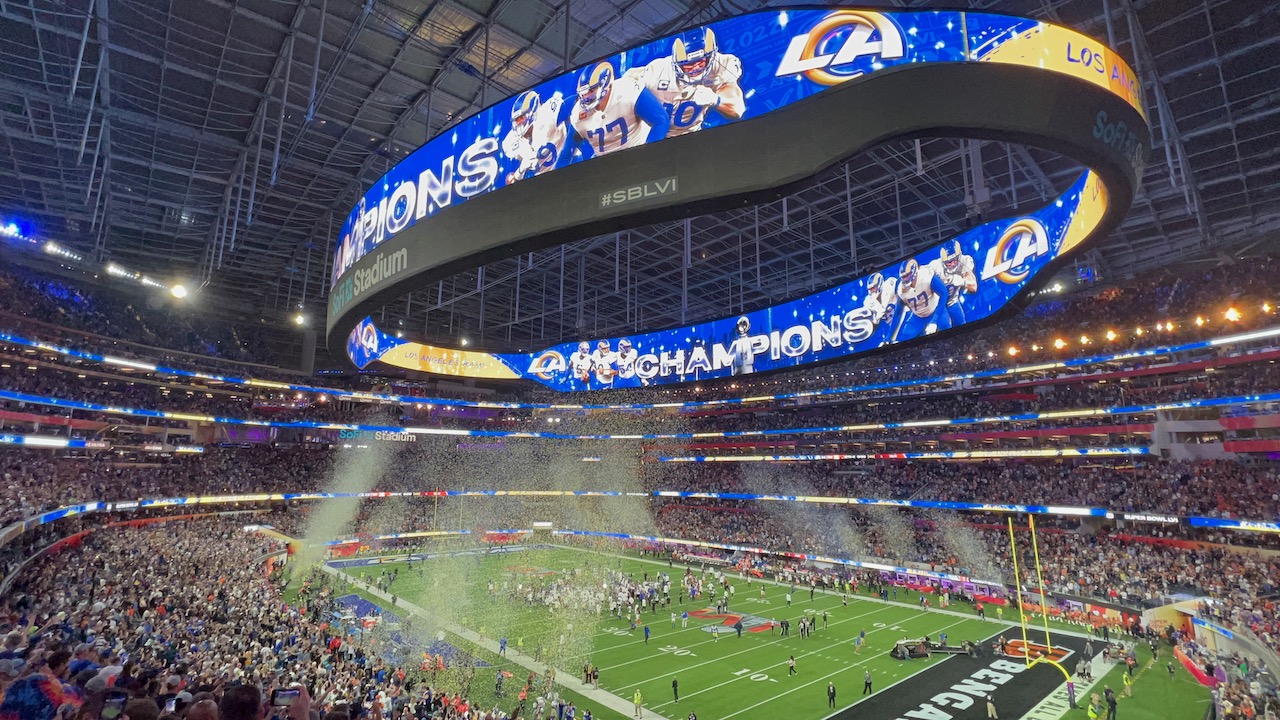
It is worth taking a moment to celebrate the milestone of 10 full years of very high-density Wi-Fi at the Big Game that was reached at SoFi stadium in February. Since the first VHD Wi-Fi implementation at AT&T stadium in 2011, Wi-Fi has gone from experimental deployments that were doubted even by their own lead engineers to being a vital and mature infrastructure service supporting an amazing and diverse array of game day user groups. Today, these groups include fan Wi-Fi as a required amenity, public safety, national security, team operations, international media, concessions, ticketing, social media, stadium IoT, and much more. Both teams even have dedicated Wi-Fi networks on each side of the field on dedicated channels for use during the game.
Stadium Tech Report recently published a chart by long time stadium integrator AmpThink that should be studied carefully by wireless engineers, national spectrum regulators, and anyone who believes that 5G is going to somehow displace Wi-Fi. Aruba has been privileged to be responsible for two of these games – at Levi’s Stadium in Santa Clara in 2016 and Mercedes-Benz Stadium in Atlanta in 2019. So, we have a unique perspective on this chart.
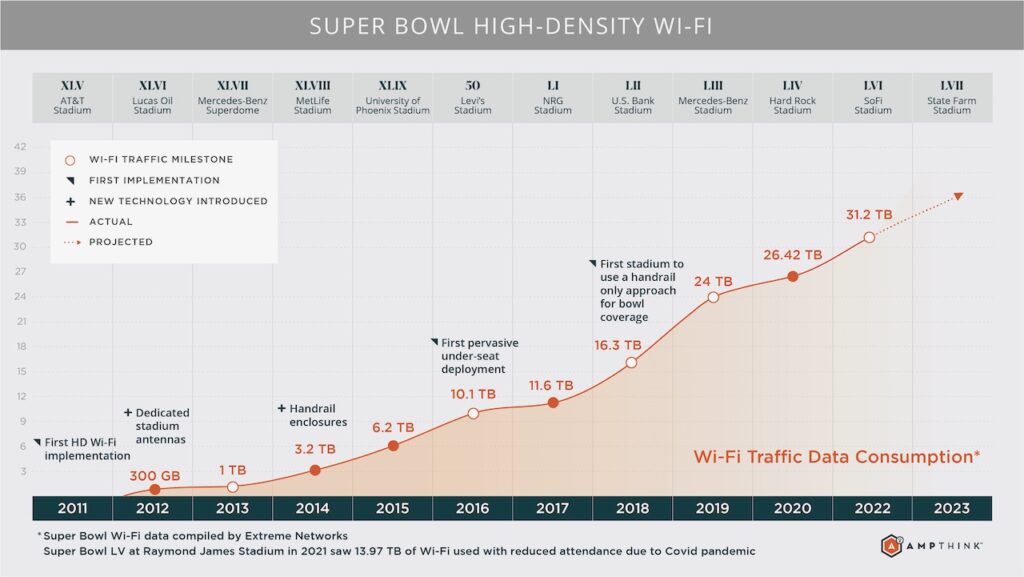
Over 10 years Wi-Fi has delivered a staggering 100X increase in carried traffic – from just 300 gigabytes in 2012 to 31.2 terabytes in 2022. Most of these figures are measured over about a 12-hour period, but on average 90 percent of the data is carried over just eight hours. This was achieved with only a 4X increase in Wi-Fi access point density – from 604 in 2012 to 2,521 this year. [1] [2] And with the recent opening of the massive new 6 GHz spectrum band there is no end in sight to this growth. Before we talk about the future though, let’s take time to celebrate this RF engineering marvel from the decade gone by.
Four separate lines of innovation drive network design and capacity supply
Professional RF engineers will appreciate that this 100X increase was extraordinarily difficult to achieve. A key part of the magic of Wi-Fi is that anyone can set up a network at any time in any place without getting permission or coordinating with anybody else. This is known as “self-coordination.” In Wi-Fi this is accomplished by sending special control signals with each transmission that are designed to be heard by other devices at very large distances (e.g. very low signal-to-noise levels – barely 4 dB) to reserve air time.
Each of the stadiums that hosted a Big Game during the last decade was about the same physical size (about four square blocks) and had about the same number of seats (average of 71,000 seats). When a stadium of this size is empty, it is easy to demonstrate that a single Wi-Fi AP on the 50-yard line on one side can block a co-channel Wi-Fi network on the other side of the field. In other words, the self-interference environment is the same in 2022 as it was in 2012. So what has enabled Wi-Fi to score such a massive increase in proven capacity?
It comes down to four things: increasing fan data demand, more spectrum, technology advances and most of all the adoption of “proximate” RF designs. Let’s look at each one.
Increasing fan data demand: The amount of data sent and received by each fan has grown significantly every year. Much of this has been driven by social media uploads of photos and videos – over the same 10 year period Facebook grew from about 900 million users to over 3 billion users. Cloud services such as iCloud, Snapchat and Instagram also grew massively. The shift from uploading primarily still photos in 2012 to 4K 60fps video in 2022 was another key bandwidth driver – driven by improvements to the underlying camera hardware. The original 2007 iPhone had a 2-megapixel (MP) rear camera whereas the current iPhone 13 boasts 12MP and recent Samsung Galaxy devices dwarf this with over 100 MP.[3] Many fans at the Big Game now stream the entire halftime show live in real time over their personal social media channels. In numerical terms, average per-device Wi-Fi usage grew by a factor of more than 20X from just 28.5 MB in 2012 to 595.6 MB this year.
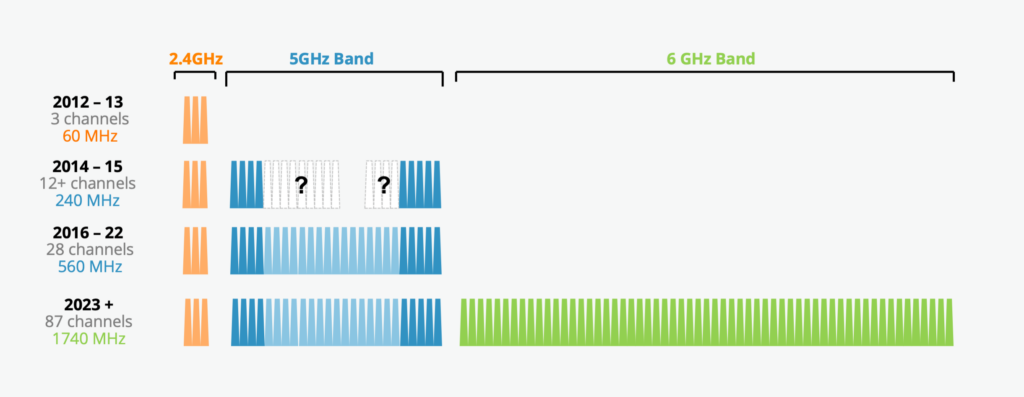
Access to more spectrum: It seems hard to believe now, but Apple did not introduce support for the 5 GHz Wi-Fi band until the iPhone 5 in 2012. Prior to this, RF architects like myself working on stadiums prayed each year for this to change because early on it was the single greatest constraint we faced. The 2.4 GHz band has only three usable 20 MHz channels. This greatly limited total potential capacity, while simultaneously increasing the level of self-interference.
From studying many years of customer network data, we know that on average it takes about two years for a new phone model to achieve at least 50 percent penetration in the connected device population. So 2014 was likely the first year with significant 5 GHz usage, and you can see this effect in the first jump on the left side of the chart.
It is also true that not all of the 5 GHz band was utilized at first. To my knowledge, 2016 was the first year that the full DFS and non-DFS channel sets were successfully employed to take advantage of the entire band. Prior to this the RF designs faced several challenges in attempting to use the 16 available DFS channels. From 2010 to 2015 the FCC restricted access to three of these channels in the middle of the band while interference reports were addressed.
Also, stadiums tend to be near or have good line of sight to airports which caused large numbers of DFS false positive detections. For example MetLife Stadium received significant DFS interference from Newark airport in 2014 rendering multiple channels unusable. These effects resulted in unpredictable access to the DFS channels during the first years of Big Game VHD Wi-Fi. As shown in Figure 2, during these early years a total of just 12 channels were known to be solid, with opportunistic access to another 10 channels. By 2016 the FCC and false positive issues were substantially resolved, bringing the full 28 channels online. The arrival of the massive new 6 GHz band promises to radically transform the fan experience yet again – likely beginning in the 2024 timeframe.
Technology advances: The decade of 100X progress in Figure 1 spans three entire generations of Wi-Fi. The first few years were deployed with Wi-Fi 4 (a.k.a. 802.11n). The Levi’s Stadium game in 2016 was the first to use Wi-Fi 5 (or 802.11ac), while the Hard Rock Stadium game in 2020 ushered in the first Wi-Fi 6 (802.11ax) network for the Big Game. Each successive generation introduced faster peak data rates – from 144.4 Mbps with 802.11n to 173.3 Mbps with 802.11ac, and 286.8 Mbps with 802.11ax. In other words, peak speed available to a typical client device increased by 2X over the last decade on a per channel basis due solely to better Wi-Fi technology.
Another technology advance helped power the massive 47 percent increase in traffic at Mercedes-Benz Stadium in Atlanta in 2019 over the previous year. This was the first use of Passpoint® by one of the three major mobile operators. Passpoint is a technology that allows mobile devices with SIM cards to detect and automatically connect to a Wi-Fi network using the owner’s cellular SIM credentials. This connection happens without any action on the part of the user. The effect of Passpoint is visible in the huge increase (20 percent) in connected devices – from 40,033 in 2018 (59 percent of attendance) to 48,845 in 2019 (or 69 percent of attendance). [4] [5] In Miami in 2020 which did not have Passpoint, connected devices dropped to 44,358, while this year the SoFi network once again featured Passpoint with one major operator helping drive total unique connected Wi-Fi devices to a staggering 57,618 (or 82 percent of attendance). [6]
Connecting more devices to Wi-Fi drives more Wi-Fi data demand, and it benefits the cellular DAS systems by sharing some of the load, relieving capacity pressure during big moments on field where cellular network airtime is typically divided such that uplink resource blocks are a fraction of downlink slots whereas Wi-Fi is not similarly constrained.
Finally, while it is virtually impossible to quantify, RF engineers reading this will note that the overall robustness of the 802.11 air interface steadily improved over each of three generations. Improvements in the maturity of MIMO, the quality of Wi-Fi implementations in end-user devices, and better error correction algorithms for challenging RF environments all contributed to the progressive increase in the median user-perceived data rate.
Adoption of under seat and handrail ‘proximate’ RF designs
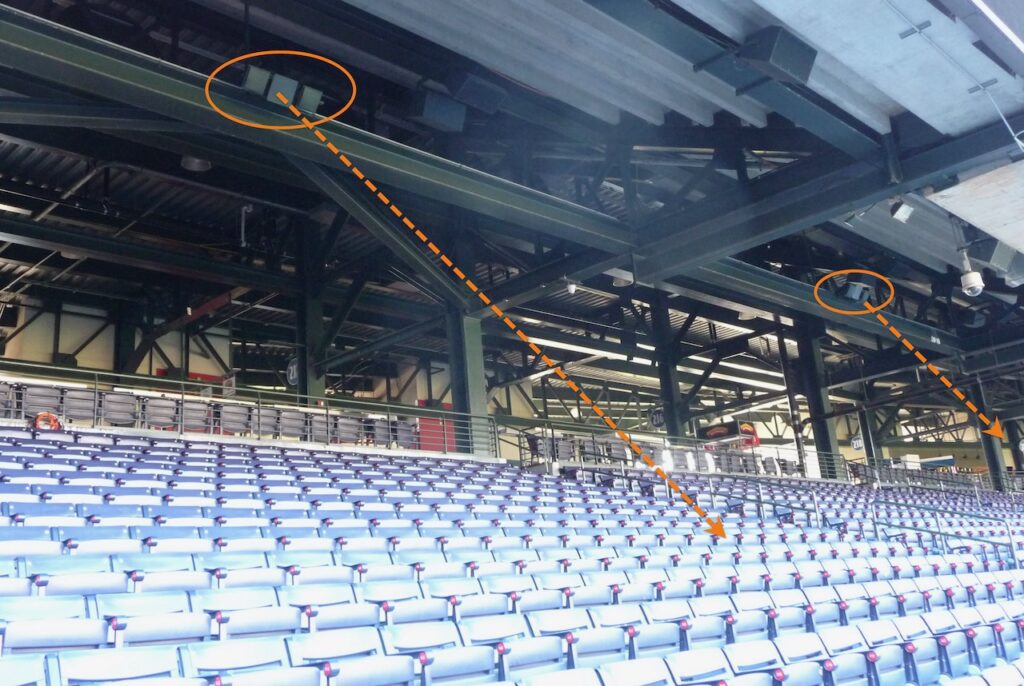
By 2012 there were many stadiums and arenas with some degree of Wi-Fi coverage. It is fair to say that none of those systems performed very well. It was painfully apparent to the small community of RF engineers that built these early venues that traditional coverage designs using “overhead” antennas positioned at the rear of seating sections and aimed at the field could not deliver the level of capacity needed at that time (much less cope with future demand). Figure 3 shows an example deployment from this period with overhead, front-firing, highly directional antennas.
Engineers at Aruba, Cisco and AmpThink experimented over several years with novel design strategies and created new antenna hardware configurations to improve system performance. Some were more successful than others, with techniques such as “leaky coax” cable attempted and subsequently abandoned. The result of these high-risk experiments eventually led to the high levels of performance that major venues now support on a daily basis. But the road to get there was very rocky.
As noted above, Wi-Fi is designed to “self-coordinate” by transmitting special airtime reservation signals that can be heard and understood by other Wi-Fi networks at long distances (or alternatively at very low signal levels). This poses an immediate and obvious problem for “overhead” designs with antennas circling the top of a seating bowl, aimed down and at the field. I’ve always referred to this design as a “circular RF firing squad.” It was obvious that the ultimate solution to this problem required a completely new approach, getting the antennas low and close to the seats.
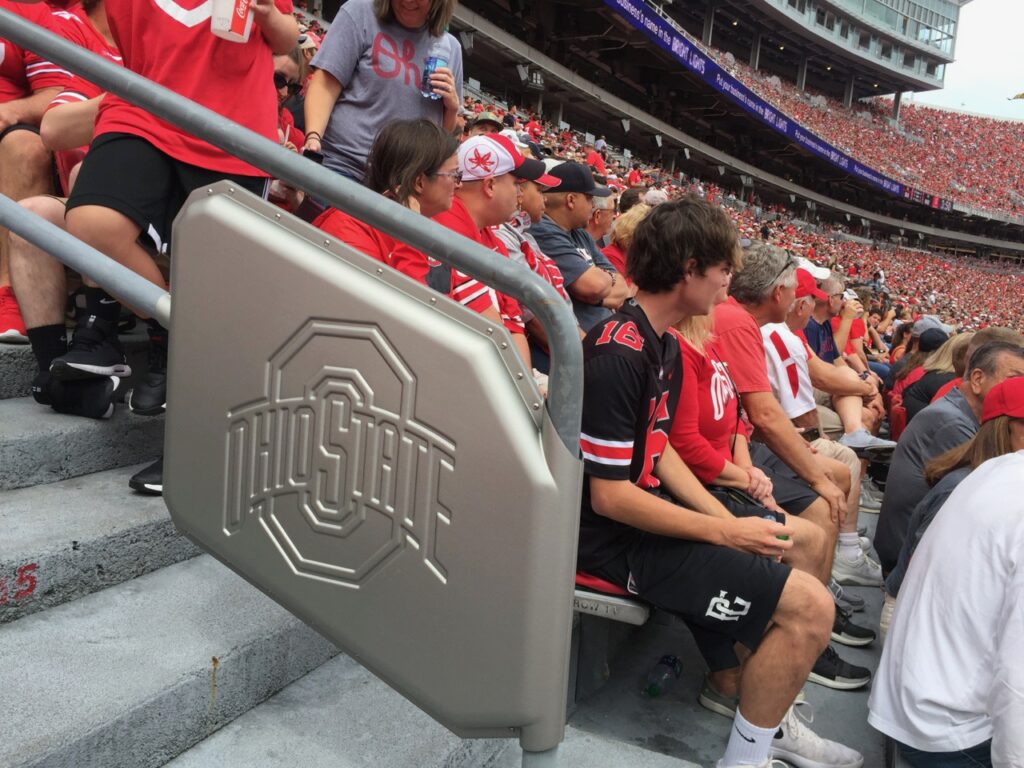
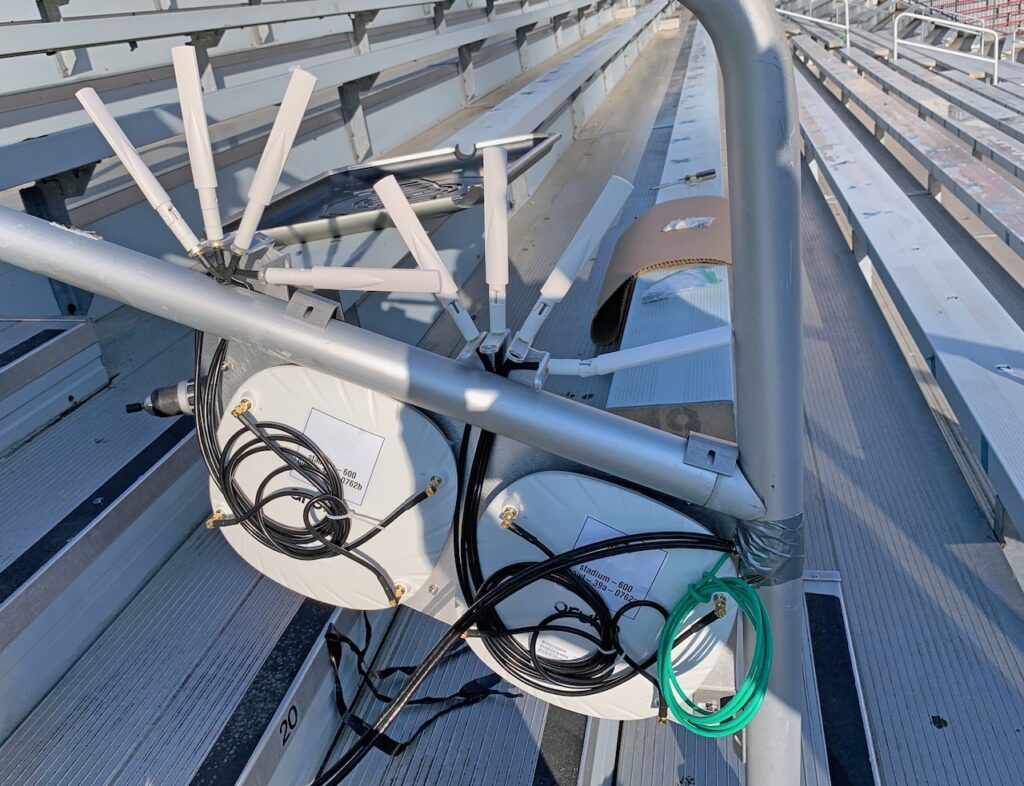
Figure 4, left: Handrail AP deployment at Ohio Stadium. Credit: Paul Kapustka, STR. Figure 4, right: inside look showing how two APs inside an enclosure fire left and right. Credit: AmpThink
AmpThink led one line of innovation to create and deploy access points in specialized handrail enclosures using APs with antennas shooting left and right from each enclosure. One example Aruba handrail deployment at Ohio State University is shown in Figure 4 – this network regularly delivers game day aggregate data rates of 15 Gbps. AmpThink CEO Bill Anderson penned an excellent article summarizing the history from overhead to handrail and under seat networks that is worth your time to read. Aruba is widely credited with the other line of innovation – mounting APs directly under seats in a honeycomb layout.
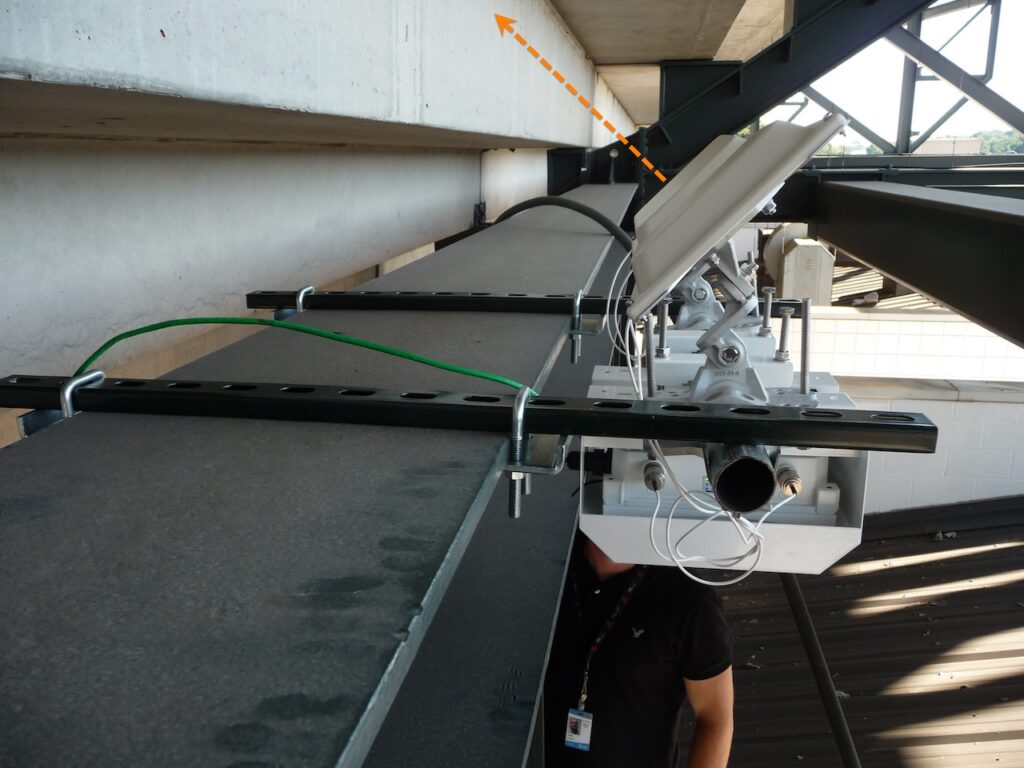
Both designs are called “proximate” networks because the objective is to locate radios very close to the devices they are actually serving in order to improve the strength and quality of the RF signal. Aruba did exhaustive field research with small scale, temporary under seat test networks covering a single seating section in the 2008 – 2010 timeframe. We then installed a partial outdoor under seat system for the upper deck at Turner Field in Atlanta in 2012.
That first system was designed to serve well over 250 seats per AP using only the 2.4 GHz band. At the time, no one believed this design could work and as a result no one would permit core holes to be drilled through the concrete deck to place APs on the fan side. Therefore, this first deployment was underneath the concrete as shown in Figure 5. While it left much to be desired, the design provided critical engineering data over a long time period that convinced future customers to agree to invest in drilling holes.
Case Study: Comparing two under-seat deployments
Levi’s Stadium in 2016 was the first to employ an all under seat design at a density of 105 seats per AP. The huge year-on-year increase in Wi-Fi usage delivered by each of these new design methods speaks for itself. As impressive as these figures were, looking at the Levi’s Stadium results we immediately knew we could do better. One advantage of the Big Game is that it can consistently generate over 10 Gbps of sustained data demand over a period of 6 or more hours.
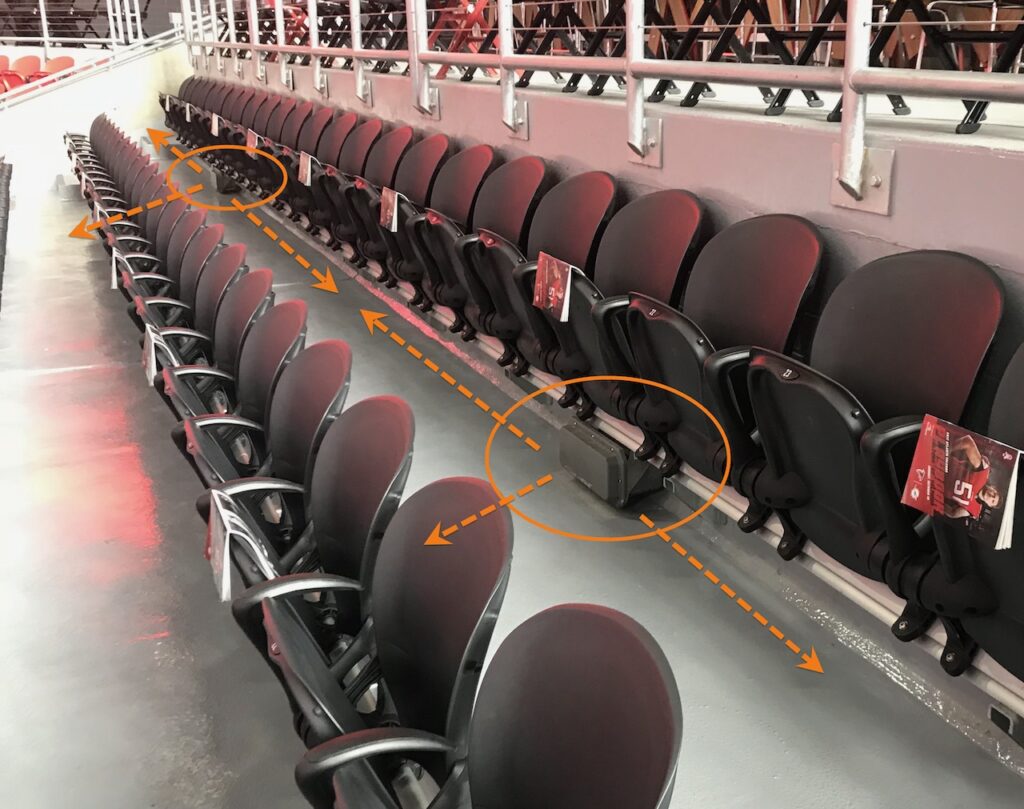
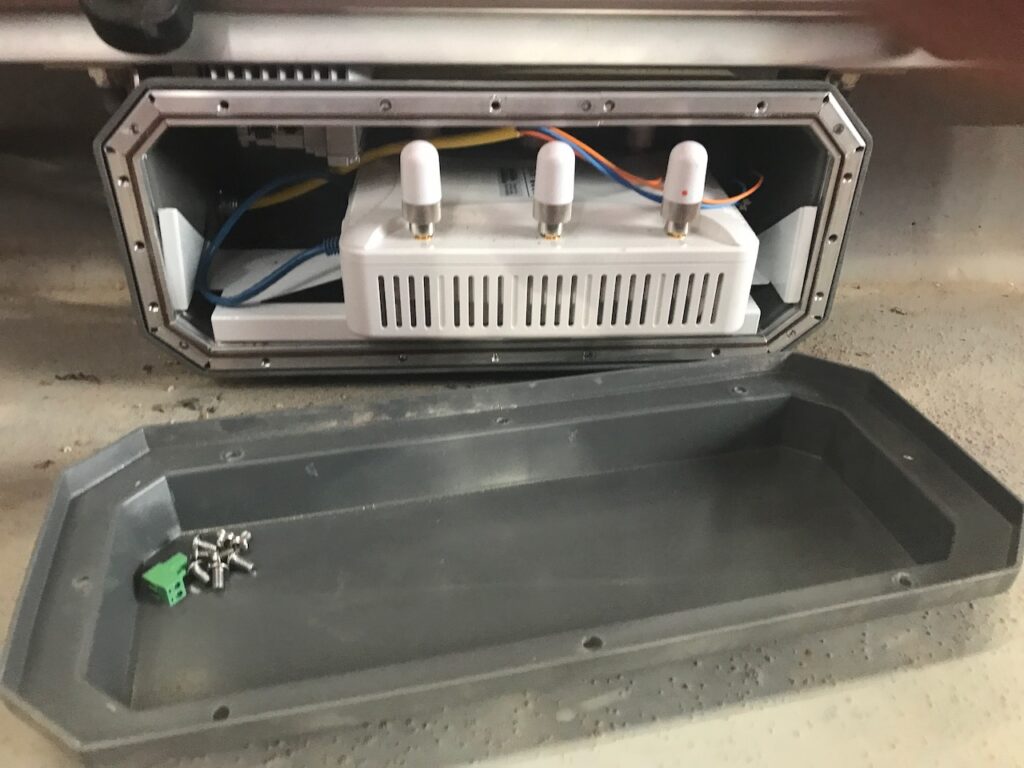
Figure 6, left: Under seat ‘proximate’ deployment at Mercedes-Benz Stadium with side-firing antennas. Figure 6, right: Inside look at the under-seat AP enclosure at Mercedes-Benz Stadium. Credit: Hewlett Packard Enterprise
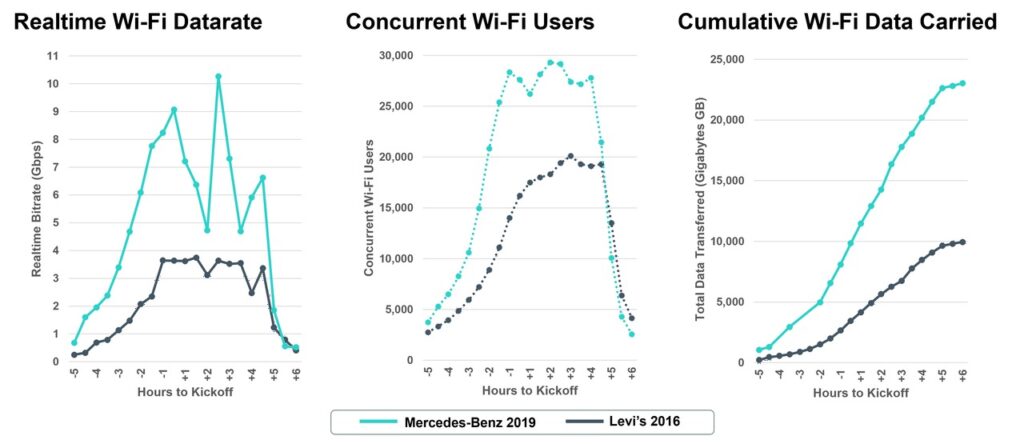
An experienced RF engineer can learn a great deal from the shape of certain performance curves during a Big Game that are rarely encountered in large public venues. Levi’s Stadium had about 700 APs in the bowl, and we knew even before the game was over that it wasn’t nearly enough – note the flatline at just under 4 Gbps in the left chart of Figure 7 (below). The data suggested that it was safe to go even denser. For Atlanta in 2019, I made the decision to increase the density by 30 percent – to 75 seats per AP – resulting in a total of over 1,100 APs just in the bowl. Photos of the actual installation are shown in Figure 6a-6b (above). This decision overcame the flatline issue and resulted in a 150 percent increase in carried load as compared with the Levi’s Stadium network three years before (as well as a 50 percent increase over the year prior in Minneapolis). Figure 7 shows hour-by-hour comparisons of the two networks, with Atlanta reaching over 10 Gbps as compared with less than 4 Gbps achieved at Levi’s in 2016. There are now several successful large-scale deployments at densities as high as 45 seats per AP – and in general Aruba is seeing that peak data rates are inversely proportional to AP density. [7]
Large-scale adoption of handrail and under-seat deployments
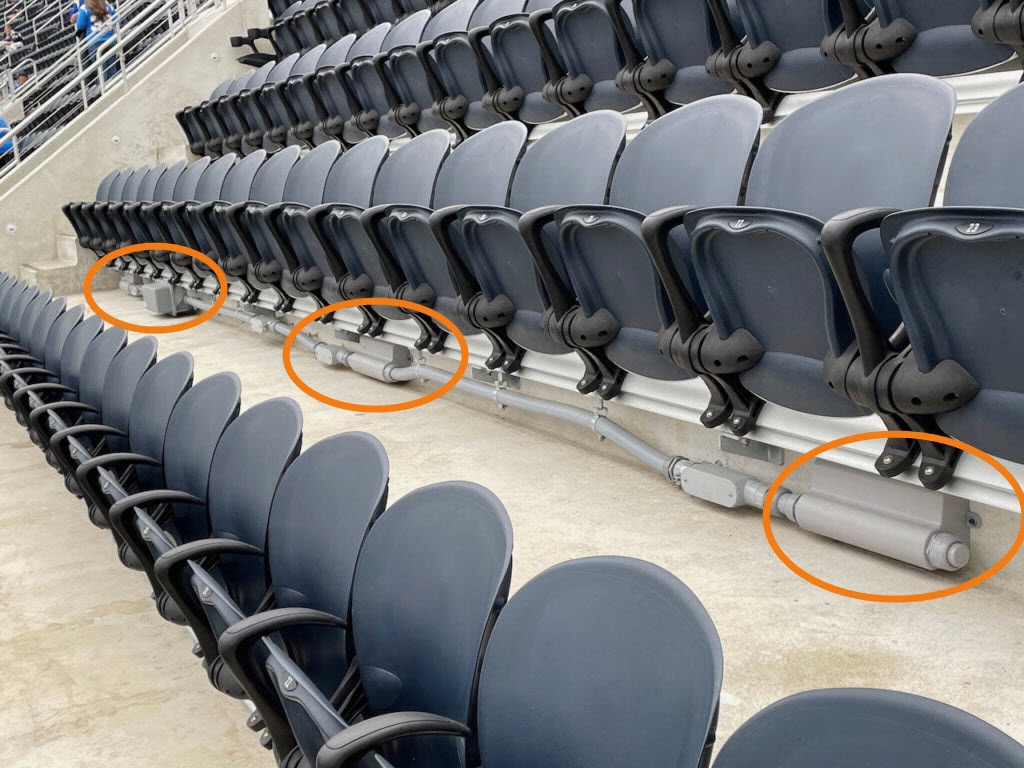
Under-seat and handrail networks were strongly resisted by venue owners in the early years because of the significantly increased cabling costs and the need to core holes into the steel reinforced concrete decks, requiring expensive construction. I cannot tell you how hard we had to fight to get those first few networks constructed, and how much faith those early customers put in our team and our small-scale field tests. I am gratified to say that today the vast majority of Wi-Fi deployments or refreshes in stadiums with 50,000 seats or more use one or both of these proximate techniques. In addition – even cellular operators have gotten into the act! By around 2016 we started to see DAS systems deployed using under-seat antennas for the same reasons. Figure 8 is a great photo from SoFi this year showing one Wi-Fi under-seat enclosure flanked by three under-seat DAS antennas and sharing a common cable pathway through the concrete.
Cellular networks also rose to meet the challenge – For over 20X more money!
AT&T, T-Mobile and Verizon also delivered huge increases in capacity over the last decade at the Big Game. While accurate numbers are hard to come by, it was reported that in 2012 cellular networks carried a total of about 560 GB. Ten years later, this past February, at SoFi Stadium, AT&T and Verizon reported a combined “in and around” the stadium total of 43.4 TB. Of that total, at least 3 TB came from AT&T’s millimeter wave 5G network. [9] “In and around” is a fuzzy definition that changes from year to year based on the specific geography of each venue, but it should be understood to include significant areas beyond the Wi-Fi footprint. So one must be careful making direct comparisons with Wi-Fi figures which are specific to the building system (usually including exterior concourses and sidewalks inside the ticket perimeter but rarely including parking lots and mass transit assembly areas).
This represents a 75X increase in total carried traffic on the macro cellular networks over 10 years, somewhat less than the 100X gain that Wi-Fi achieved solely inside the stadium but largely due to similar factors (new technology, more spectrum, better design). And it’s certainly true that it took every possible megahertz from the cellular operators in addition to Wi-Fi to meet the totality of user demand.
That said, it is fair to point out that Wi-Fi typically carries as much traffic as all the cellular operators put together. And Wi-Fi carries as much or more than any single cellular network on the “in and around” reporting basis. This should be no surprise since the major U.S. mobile network operators (“MNOs”) collectively own a little less than 500 MHz of spectrum dedicated to 4G and 3G. This is almost identical to the amount of Wi-Fi spectrum in the 5 GHz band. New 5G cellular spectrum is coming online in the mid-band, and in millimeter wave and Wi-Fi is growing with the 6 GHz band too. Therefore, it’s reasonable to expect the systems to maintain parity, carrying more and more traffic well into the future.
Putting my CTO hat on, I would argue that the Big Game is the only real world “apples to apples” test of fully scheduled air interfaces (e.g. cellular networks) against the statistical, self-coordinated air interface of Wi-Fi. One argument of cellular proponents against Wi-Fi over the years has been that it’s simply not dependable because it’s not rigidly scheduled like 4G/5G networks. But beginning with Wi-Fi 6, Wi-Fi, 4G and 5G all use the same underlying air technology (OFDMA with QAM modulation). And at least until this year with some of the new 5G spectrum being deployed at SoFi, they had parity on a megahertz basis. Ergo, if they are each carrying similar traffic volumes over the same time period and comparable spectrum amounts, it must follow that both the statistical channel access method of Wi-Fi and the scheduled method of LTE/5G are equally capable of absorbing comparable amounts of load.
The gold standard for evaluating radio system performance on an apples-to-apples basis is “spectral efficiency.” This is typically measured in “bits per second per Hertz.” In simple terms, this is a measure of how much information can be carried per second in the smallest unit of spectrum (one Hertz or “1 Hz”). By way of example, the LTE Advanced system is rated at 30 bits/second/Hz for a single system deployment.[10] In the February Big Game at SoFi, a peak of 20.7 Gbps was reported for the Wi-Fi system. Assuming 500 MHz of total spectrum in use this works out to a systemwide spectral efficiency of 40 bits/second/Hz. This is an exceptional level of performance for any radio system, much less one with extremely high levels of channel reuse and a non-scheduled air interface. In short, it is as good as or better than state of the art cellular network efficiency.
One other comparison is worth making: cost per gigabyte carried. For years now the annual Big Game headlines typically include announcements of well over $50 million of combined investment by the MNOs to upgrade the in-stadium DAS systems along with nearby street-level coverage for a few square miles around the stadium. In 2021, Verizon spent over $80 million at Hard Rock Stadium in Miami and this year it was a staggering $119 million (though that is no doubt skewed by one-time 5G infrastructure upgrades).[11] For this investment, Verizon carried 30.4 terabytes during the game, resulting in a whopping $4 million per terabyte carried. By contrast, a state-of-the-art Big Game class Wi-Fi system can be built for as little as one twentieth of this amount (about $6 million for a typical system) while carrying the same amount of traffic. This works out to less than $200 thousand per terabyte – resulting in WiFi costing 20X less than cellular. Wi-Fi is clearly the more cost-efficient network type by a large margin.
The future of stadium Wi-Fi
The data should firmly put to rest any question about the ability of Wi-Fi to scale to meet rapidly growing demands. Similarly, anyone who has questioned the robustness of Wi-Fi under extreme conditions should be impressed by the sheer proven scale of performance. The 100X growth in delivered capacity we’ve reviewed in this article spans three generations of Wi-Fi, equipment from three Wi-Fi equipment manufacturers, and three distinct phases of RF design. It is not an accident, but rather the result of reasoned engineering and extensive empirical field testing and optimization over many years. Well-engineered Wi-Fi systems are fully capable of elastically scaling to absorb sustained demand loads on the order of 20 Gbps or more in confined spaces for many hours at a time.
The 6 GHz band will realistically come online by the 2024 game. Probably indoors at first because the band is not yet open for outdoor operations. It’s more likely than not that the 2025 Big Game will also feature outdoor Wi-Fi 6E access points. Client devices that can access the 6 GHz band are already selling widely, with the Wi-Fi Alliance estimating that several hundred million such devices will have been sold by the end of this year. By the time the 6 GHz APs are ready, the clients will be there in large enough numbers to make a difference. This will power the next big jump in Wi-Fi data growth.
Millimeter wave is also going to be important, both for 5G cellular and potentially for Wi-Gig in the 60 GHz band. The United States has allocated 14 GHz of spectrum for Wi-Gig, enough for seven channels – each delivering 10+ Gbps over short ranges. Now that stadiums are accustomed to investing in structured cabling and pathways underneath bowl seating, millimeter deployments may become more realistic from a cost perspective. Regardless, look for both demand and supply of wireless data at the Big Game to continue to march higher and higher with each passing year.
Acknowledgements
To be the lead RF engineer responsible for a Big Game is to literally put one’s career on the line. There is a small, elite group of engineers who have been fortunate to serve in this capacity. Collectively, they have built upon one another’s engineering advances and made possible the incredible 100X progress over the last decade. I am privileged to be in their company and wish to recognize all those of whom I am aware:
- Aruba: Chuck Lukaszewski, Adam Sauers, Marcus Wehmeyer & Clark Vitek
- AmpThink: Bill Anderson, Wesley Terry and Spencer Bowen
- Cisco: Matt Swartz, Pete Sakosky, Josh Suhr, Dan Campbell, Jake Fussell

[1] Super Bowl plans to handle 30,000 Wi-Fi users at once—and sniff out “rogue devices” | Ars Technica
[2] Super Bowl LVI at SoFi Stadium sees 31.2 terabytes of Wi-Fi usage, a new record – Stadium Tech Report
[3] 12 Years of IPhone Camera Evolution [Infographic] (netbooknews.com)
[4] Fans use 16.31 TB of Wi-Fi data during Super Bowl 52 at U.S. Bank Stadium (mobilesportsreport.com)
[5] Super Bowl 53 smashes Wi-Fi record with 24 TB of traffic at Mercedes-Benz Stadium (mobilesportsreport.com)
[6] Super Bowl LIV sets new Wi-Fi record with 26.42 TB of data used (mobilesportsreport.com)
[7] Stadium Tech Report: Upgrades keep San Francisco Giants and AT&T Park at front of stadium DAS and Wi-Fi league (mobilesportsreport.com)
[9] Verizon, AT&T hit new highs for big-game cellular data use at Super Bowl LIV – Stadium Tech Report
[10] Spectral efficiency – Wikipedia
[11] Verizon returns to Super Bowl to spotlight new 5G Internet (globenewswire.com)


