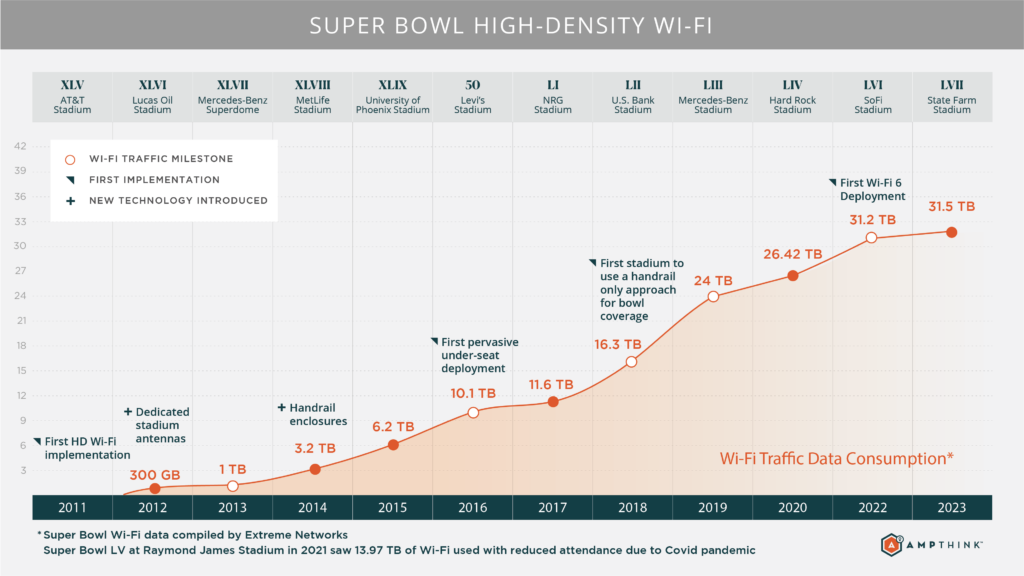
The Wi-Fi network data usage at this year’s Super Bowl LVII just barely set a new high-water mark for the big game, with 31.5 terabytes used just topping last year’s total of 31.2 TB, according to statistics released by Extreme Networks.
And while the event did see a new record in the per-fan usage of data at 643 megabtyes per device, its Wi-Fi mark fell short of setting an overall top Wi-Fi day record due to the 34.8 TB number seen at an Ohio State game this past fall.
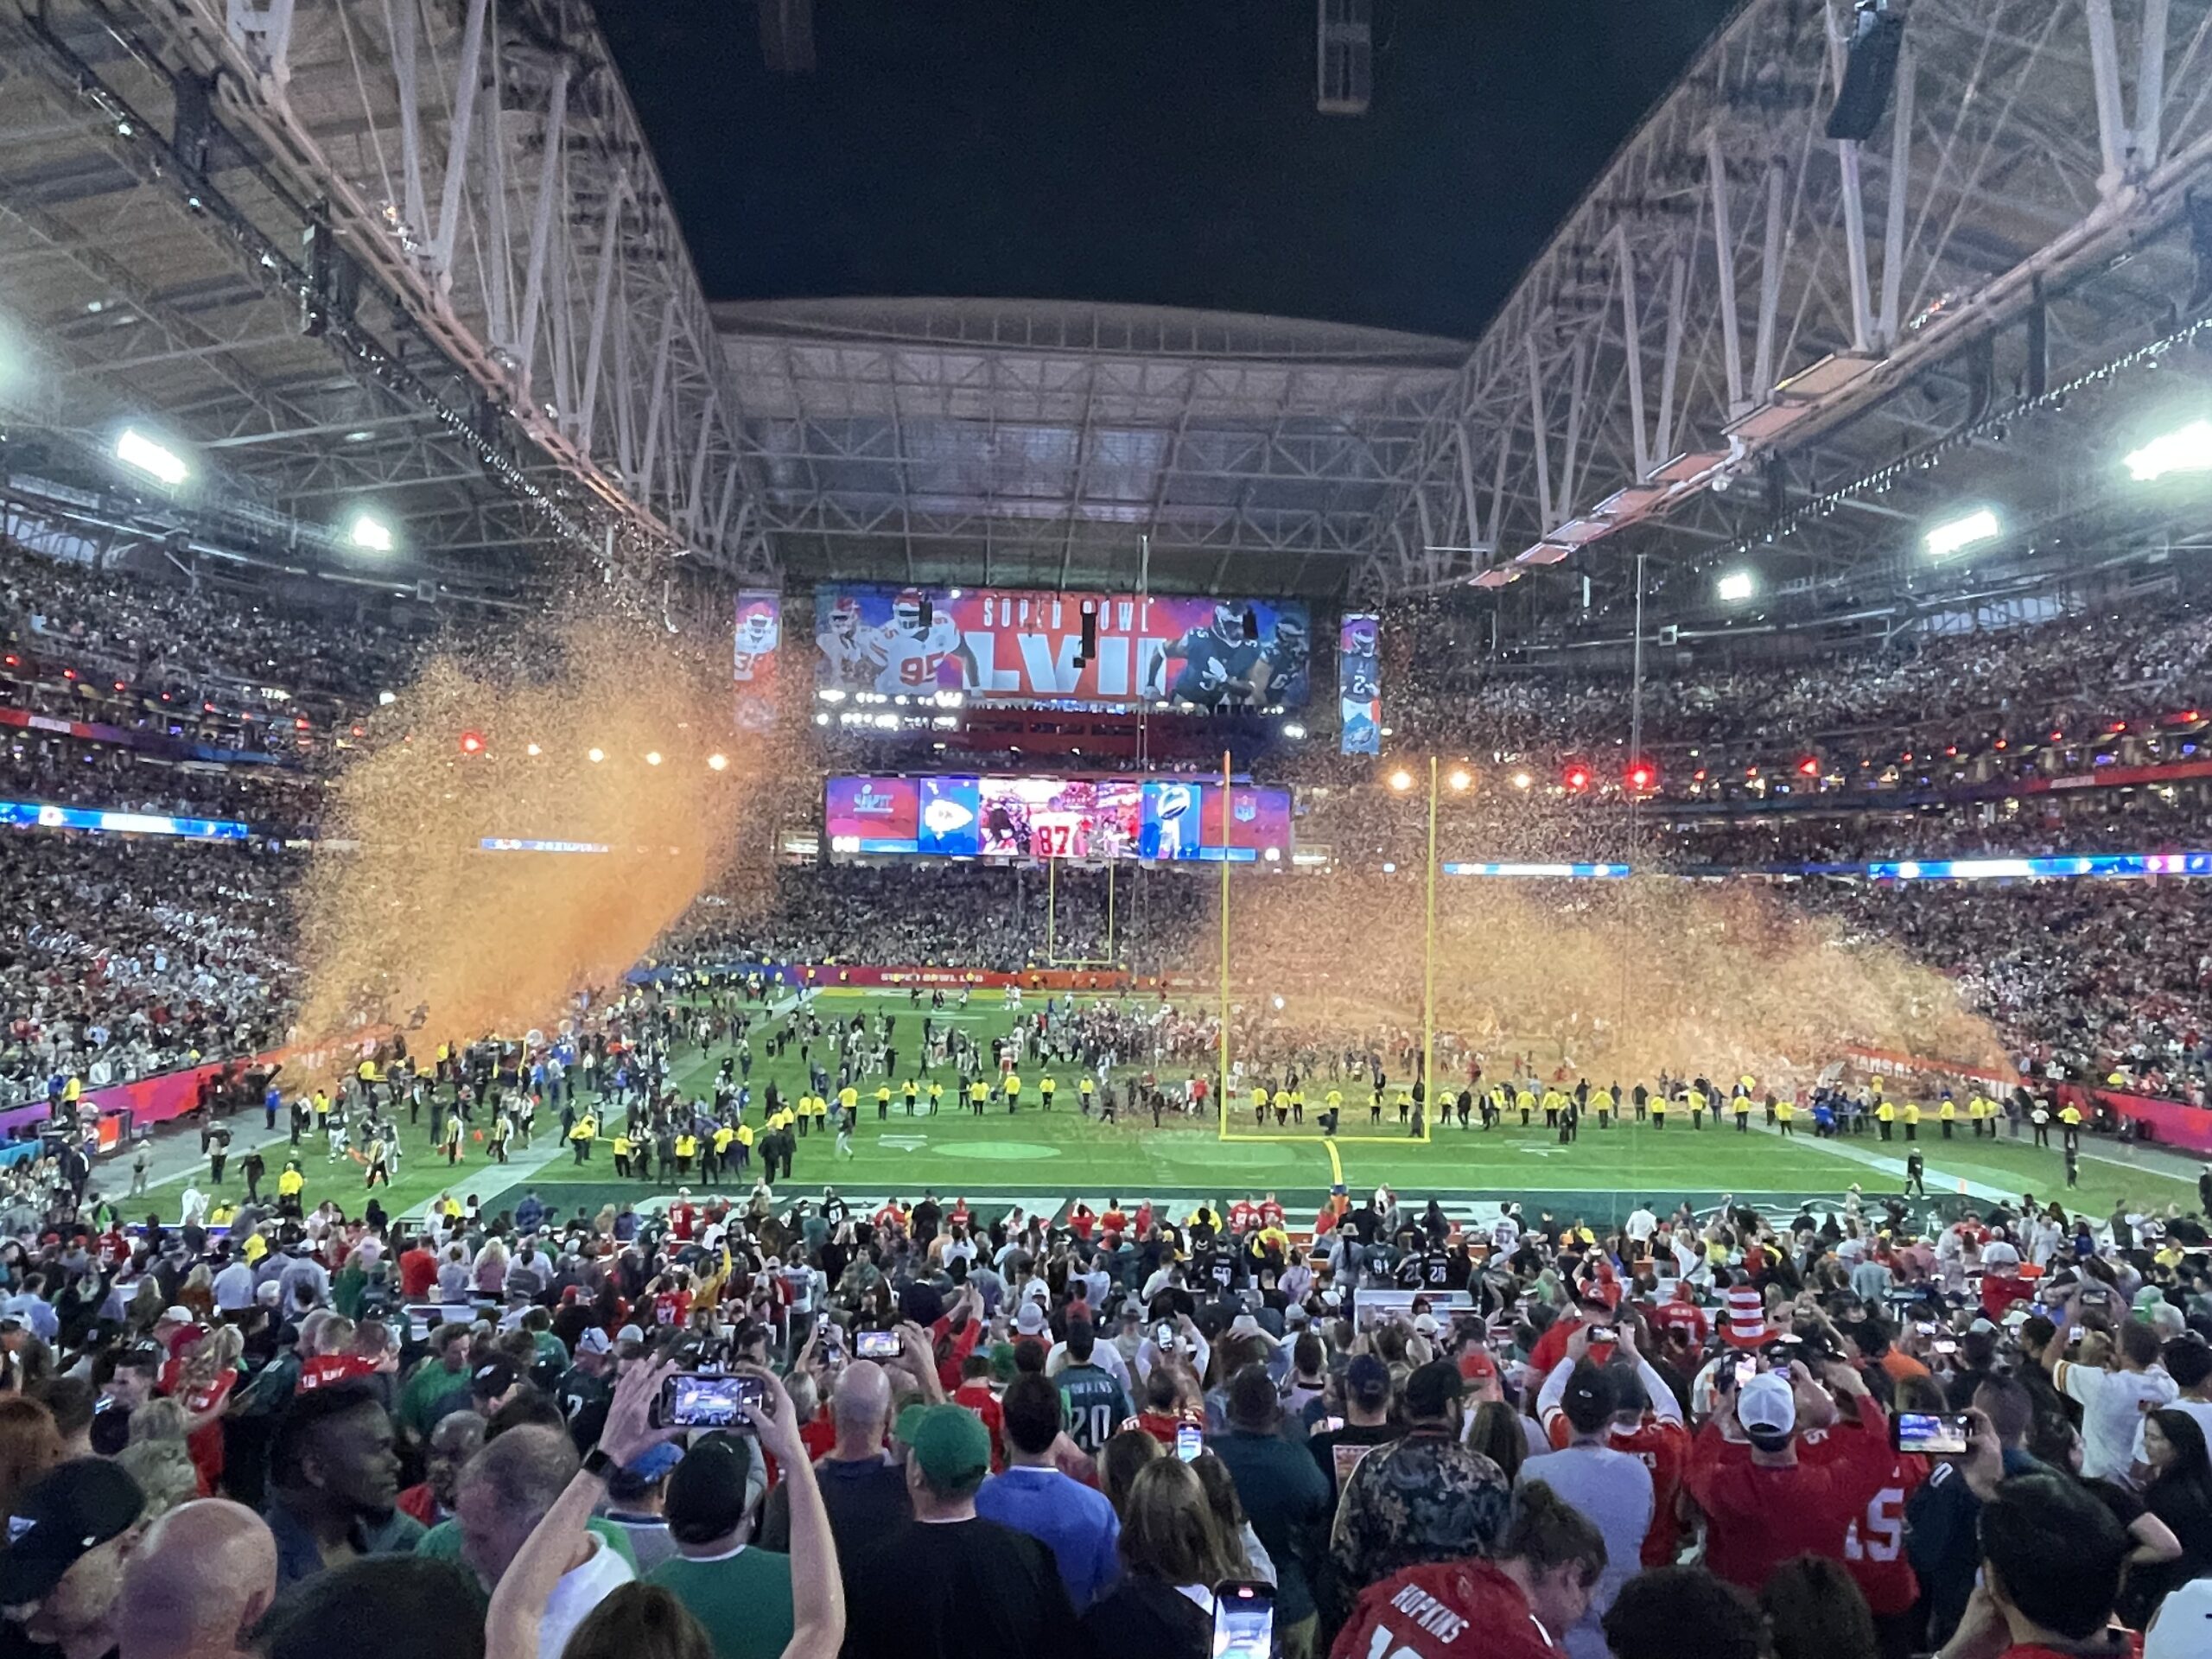
We are still working with Extreme reps to try to get more clarity on the stats just from the game, a thrilling 38-35 victory for the Kansas City Chiefs over the Philadelphia Eagles on Feb. 12, 2023, at State Farm Stadium in Glendale, Ariz. But some of the numbers we did get are worth diving into, especially the very small overall jump in Wi-Fi usage, which can possibly be explained due to several factors.
Fewer fans, but more data per connected device
While historically over the recent past we have been treated to big jumps each year in overall Wi-Fi data usage at each Super Bowl, the smaller attendance at this year’s Super Bowl of 67,827 fans (compared to 70,048 at last year’s game) was just one factor that likely contributed to the “smaller” overall growth. The Ohio State game that set the new top mark, for example, had 106,787 in attendance.
However, the number we’ve been paying more attention to at the past few non-Covid events — the average data used per connected device — did show a big jump this year at the Super Bowl, with the 643 MB per device setting a new high mark, besting the 595.6 MB per device set at Super Bowl LIV in Miami in 2020.
Another interesting number to note from this year was the 10 percent drop in “take rate,” or the number of fans on the Wi-Fi network out of the total number of fans present. This year’s numbers of 48,923 connected devices out of 67,827 total attendance showed only a 72 percent Wi-Fi take rate, down from a high of 82 percent at Super Bowl LVI last year at SoFi Stadium when 57,628 devices connected to the network out of 70,048 total attendance.
Possible explanations for the lower take rate include the lower number of Wi-Fi APs installed at the two stadiums (approximately 1,500 at State Farm Stadium compared to 2,521 at SoFi Stadium), as well as the expanded 5G cellular connectivity installed at State Farm Stadium ahead of the Super Bowl, which did lead to record-breaking jumps in the cellular data used at the big game. We are still working with the top cellular carriers to see if there had been a significant jump this year in 5G-only traffic, so stay tuned.
But the jump in per-device usage is an interesting one, maybe perhaps due to the increase of consumer devices that support the Wi-Fi 6 standard? According to stats from Ohio State and others, pure Wi-Fi 6 traffic has been increasing lately, which may mean that the touted attributes of the Wi-Fi 6 standard are finally flexing! We have asked Extreme to see if they can provide Wi-Fi 6 specific numbers, so stay tuned.
As we detailed in our Super Bowl wireless preview, the new Wi-Fi 6 network at State Farm Stadium uses gear from Cisco, including the new Cisco 9104 antennas which provide farther-reach coverage that allows for placements on structures farther away from the fans. So why do we quote Extreme Networks for statistics? That’s because official Super Bowl Wi-Fi usage numbers are supplied by Extreme under Extreme’s deal with the NFL as its Official Wi-Fi and Wi-Fi analytics provider.
Pregame, halftime cause predictable spikes in traffic
According to Extreme the network also saw a record peak throughput rate of 25.8 Gbps, topping last year’s record mark of 20.7 Gbps. The Extreme release did note that “The peak spike in bandwidth occurred when teams were announced and entered the field,” with 193.5 GB recorded at that time. The Extreme release also said that the halftime show featuring Rihanna and singers on the amazing airborne stages “drove a 450%+ increase in bandwidth usage” on the Wi-Fi network, though it did not say from what level the increase took place.
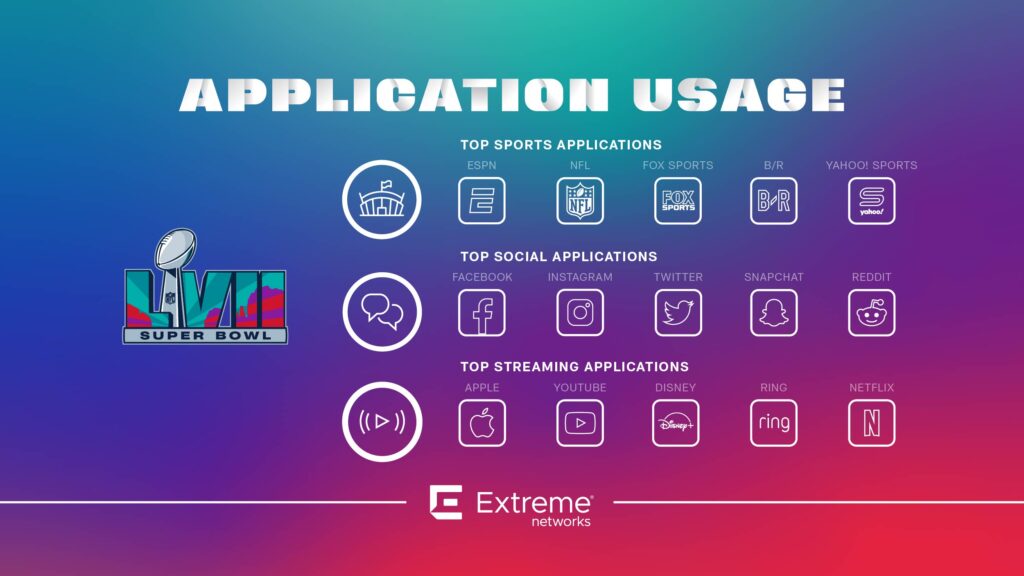
Extreme also broke out data into an infographic showing the top apps used in several categories, but did not provide statistics comparing app usage across the categories. In sports apps, ESPN was first, followed by the NFL, while Facebook lead the social-media parade followed by Instagram, Twitter, Snapchat and Reddit in descending order. Apple, YouTube and Disney were the top three streaming apps, followed by Ring, an interesting addition as maybe fans at the game were checking their front doors remotely? Netflix came in fifth in streaming apps, which in the past Extreme execs had said could be due to fan groups with small children, who may prefer their favorite shows to the football game.
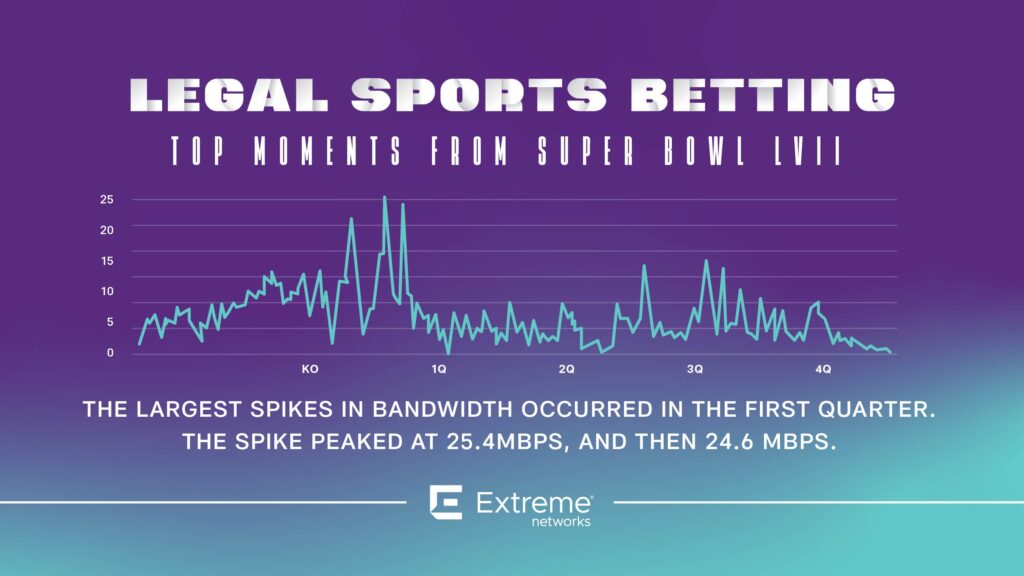
Extreme also broke out some statistics showing spikes in usages of sports betting apps (see below), but the small numbers made us wonder if fans are really using the betting apps, or if they are still more hype than reality. One thing we noted was that no betting app appeared in the top-apps lists from Extreme.
